
Ecommerce growth is the sustained increase in revenue generated by an online retail operation through coordinated improvements across acquisition, conversion, and retention. Businesses that compound all three levers simultaneously, rather than chasing isolated channel tactics consistently outpace those that optimize in isolation. The gap is structural, not cosmetic.
In this article, we break down the frameworks, strategies, and operational principles that drive scalable ecommerce growth in 2026 and why the brands winning today are no longer treating growth channels as separate disciplines, but as interconnected revenue ecosystems.
What is ecommerce growth?
Ecommerce growth is the measurable, compounding increase in revenue that results from improving how an online store attracts, converts, and retains customers. It is not synonymous with traffic growth, traffic is one input among several. The distinction matters operationally: a store that doubles traffic while holding conversion rate and retention constant doubles its revenue linearly. A store that improves all three levers by 20% each more than doubles it through compounding.
The global ecommerce market is projected to reach $6.88 trillion by the end of 2026, with ecommerce now accounting for approximately 20.5% of total global retail sales, according to Shopify’s 2026 global ecommerce report. That number will reach 21.1% by 2027. The opportunity is real. The question is not whether the market exists, it is whether any given business has the infrastructure to capture a profitable share of it.
Why ecommerce growth is harder to sustain in 2026
The structural conditions for ecommerce growth have shifted in ways that make the standard acquisition-first playbook less effective than it was.
Customer acquisition costs are rising, not falling. Meta CPL reached $27.66 in 2025, up nearly 21% year-over-year, per Genesys Growth’s 2026 CAC benchmarks. Google Ads CPCs climbed 12.88% over the same period. These are structural increases driven by auction inflation from enterprise and marketplace retailers, not cyclical fluctuations that will self-correct.
Conversion rates have not kept pace with traffic investment. The average global ecommerce storewide conversion rate sits between 2.5% and 3% in 2025, according to Triple Whale’s ecommerce benchmarks. Cart abandonment runs at 70.22%. For every 100 visitors a store pays to attract, approximately 70 leave without purchasing often after generating enough behavioral signals to indicate a recoverable intent. That is a structural revenue leak, not a content problem.
Personalization has become the baseline, not a differentiator. McKinsey’s 2024 Next in Personalization report found that leading ecommerce businesses generate 40% more revenue from personalization than average performers, and that personalization drives a 10–15% revenue lift across segments. Businesses that have not operationalized personalization at the product, email, and retargeting layer are now competing at a measurable disadvantage.
AI is reshaping how customers discover and buy. McKinsey’s October 2025 Agentic Commerce report estimated that AI agents making purchasing decisions autonomously on behalf of consumers could redirect $3 to $5 trillion in global retail spend by 2030. Ecommerce operators who build for AI-mediated discovery today through structured data, answer engine optimization (AEO), and generative engine optimization (GEO) will hold a structural advantage as this channel matures.
These conditions collectively mean that adding more spend to existing acquisition motions produces diminishing returns. A different operating model is required.
The ecommerce growth equation: three levers that compound
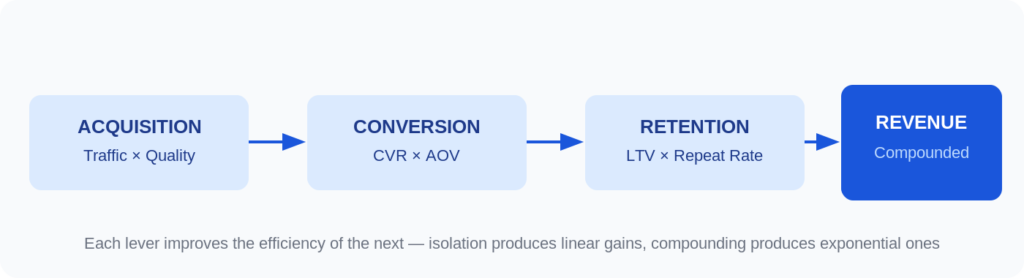
The formula that explains most ecommerce revenue outcomes is straightforward :
Revenue = Traffic × Conversion Rate × Average Order Value × Repeat Purchase Rate
Each variable interacts with the others. Improving any single variable in isolation produces linear gains. Improving multiple variables simultaneously produces compounding returns. This is the structural reason top-performing ecommerce businesses widen their lead over time, not because they work harder, but because their system is designed to compound rather than reset.
Lever 1 : acquisition
Acquisition is the process of attracting visitors with genuine purchase intent and product-market fit. Traffic volume is not a reliable proxy for acquisition quality, a store can double sessions while revenue stays flat if the incremental traffic is misaligned with the offer.
The highest-leverage acquisition channels for ecommerce in 2026 combine intent signals with scalable, persistent reach: organic search for compounding visibility, paid search for high-intent capture at controlled CAC, and increasingly, AEO and GEO for AI-mediated discovery. Building for next-generation SEO now means being present not just in Google’s index but in the AI-surfaced results that are beginning to redirect buying decisions before a user visits any website at all.
The acquisition goal is not maximum traffic. It is the right traffic at the lowest sustainable cost per acquired customer, measured against LTV.
Lever 2 : conversion
Conversion is where the majority of ecommerce revenue is lost. With average conversion rates at 2.5–3% and cart abandonment at 70.22%, the median store loses most of the revenue its acquisition spend could generate before a transaction occurs.
The conversion lever covers: product page quality, site speed, checkout friction, payment method coverage, social proof, mobile experience, and personalization. Mobile conversion rates average 1.5–2% versus 3–4% on desktop, a gap that represents a structural revenue leak for any business where mobile accounts for more than half of sessions. Identifying where conversion drops in the funnel is the prerequisite for any optimization program worth running.
Lever 3 : retention
Retention determines whether ecommerce growth compounds or resets with every acquisition cycle. A business with strong retention benefits from each new customer at a fraction of the cost of acquiring the next. A business with weak retention perpetually spends its acquisition budget replacing churned customers rather than growing net revenue.
The metrics that govern retention are lifetime value (LTV), repeat purchase rate, average order frequency, and LTV:CAC ratio. A sustainable ecommerce growth strategy anchors revenue targets to LTV, not first-purchase revenue because the unit economics of acquisition only hold when the customer relationship extends beyond a single transaction.
How to build an ecommerce growth system
The businesses widening their lead in ecommerce share a structural trait: they run a coordinated system, not a list of disconnected initiatives. The system has four components that feed a single revenue metric.
Data foundation
Growth decisions without a unified analytics stack are assumptions treated as strategy. The minimum viable data foundation includes a single source of truth for LTV, CAC, and revenue by cohort; attribution that accounts for multi-touch journeys; and dashboards that surface decisions, not activity volume. Dashboards that nobody acts on are decorative.
Acquisition engine
The acquisition engine covers every channel that brings new customers in organic search optimized for AEO and GEO alongside traditional SEO, paid search and social with strict CAC ceilings by channel, and partnership or affiliate channels where unit economics hold. The engine is measured by contribution to revenue, not traffic or spend.
Conversion stack
The conversion stack optimizes the path from first visit to completed purchase. Product page quality, checkout friction, personalization, and recovery sequences for cart abandonment are the primary levers. McKinsey’s 2024 personalization data showing a 40% revenue gap between leaders and laggards makes personalization an operational priority, not a feature roadmap item.
Retention loop
The retention loop automates the post-purchase experience to maximize LTV and repeat purchase rate. This includes onboarding sequences, replenishment triggers, cross-sell flows, and win-back campaigns for lapsed customers. Sustainable ecommerce revenue growth requires LTV to systematically exceed 3× CAC, anything below that ratio signals a structural acquisition or retention problem that additional spend will not solve.
The most common ecommerce growth mistakes
Optimizing channels instead of the system.
The most consistent pattern among ecommerce businesses that plateau is a focus on individual channel performance rather than interactions across channels and funnel stages. A business can have the best-performing ad account in its category and still produce poor returns if conversion rates and LTV are below benchmark.
Measuring growth in traffic instead of revenue per visitor.
Revenue per visitor (RPV) : conversion rate multiplied by average order value, captures both levers simultaneously. Businesses that use traffic as a proxy for growth health miss the structural inefficiencies compounding underneath.
Running conversion optimization on checkout without fixing the funnel upstream
Checkout optimization produces limited returns when the primary abandonment happens earlier on product pages, during search navigation, or due to trust deficits. Funnel audits begin at the top, not the bottom.
Scaling acquisition before retention works
Adding spend to a leaking funnel accelerates cash consumption, not revenue. A business with a 90-day repeat purchase rate below 20% and LTV below 2× CAC should invest in retention infrastructure before increasing acquisition budget.
Measuring ecommerce growth: the right metrics
Revenue per visitor (RPV)
Conversion rate × average order value. The single most efficient measure of commercial performance, it captures both conversion and pricing leverage in one number.
LTV:CAC ratio
Should consistently exceed 3:1. Below 2:1 signals a structural problem in acquisition cost, customer quality, or retention. Below 1:1 means the business is paying more to acquire customers than it recovers from them.
Repeat purchase rate at 30, 60, and 90 days:
Category-dependent, but below 20% at 90 days for consumables warrants immediate retention infrastructure review.
Revenue from returning customers as a share of total revenue
For a scaling ecommerce business, this metric should grow over time as the customer base matures. A declining share signals that retention is not keeping pace with acquisition.
Gross margin by channel and cohort
Not all revenue is equal. A channel with strong CAC efficiency but margin-destroying promotional mechanics can produce negative unit economics at scale. Gross margin by cohort reveals the actual profitability of growth.
The bottom line on ecommerce growth
Ecommerce growth is not a channel problem, it is a systems problem. Businesses that treat acquisition, conversion, and retention as separate workstreams will always hit a ceiling, because each lever operates at a fraction of its potential when the others are underperforming.
The businesses pulling ahead in 2026 are not spending more. They are running a tighter system: a data foundation that surfaces decisions rather than activity, an acquisition engine measured by revenue contribution rather than traffic, a conversion stack that makes every visit count, and a retention loop that compounds the value of every customer acquired.
The global ecommerce market is growing at 7–8% annually. That growth will not distribute evenly. It will accrue to businesses with the infrastructure to capture it profitably and to those that identify and fix their revenue leaks before adding more spend on top of them.
FAQ
Q1 : What is ecommerce growth?
Ecommerce growth is the sustained, measurable increase in revenue generated by an online retail operation through coordinated improvements in acquisition (traffic quality and volume), conversion (rate and average order value), and retention (repeat purchases and lifetime value). It is distinct from traffic growth, which is one input among several and not a reliable standalone proxy for business health.
Q2 : What is a good ecommerce growth rate in 2026?
The global ecommerce market is growing at approximately 7–8% annually heading into 2026. Businesses growing at or above this rate are keeping pace with the market. Businesses in high-growth categories targeting underserved segments typically need 20–30%+ annual growth to build durable positioning. The more operationally useful question is: is growth profitable, and is the LTV:CAC ratio improving as volume scales?
Q3 : What are the biggest ecommerce growth drivers in 2026?
The three highest-leverage growth drivers in 2026 are: conversion rate optimization on mobile, where average rates remain structurally low at 1.5–2%, personalization at scale where McKinsey’s 2024 data shows a 40% revenue gap between leaders and average performers and (3) AI-mediated discovery through AEO and GEO, where early positioning in generative search creates compounding visibility advantages as agentic commerce scales.
Q4 : How do rising customer acquisition costs affect ecommerce growth?
Rising CAC compresses margins on acquisition-dependent growth models. With Meta CPL up 21% and Google CPCs up 12.88% year-over-year in 2025, businesses relying primarily on paid acquisition face structural margin pressure. The strategic response is to improve conversion rates and LTV to maintain profitable unit economics not to cut acquisition spend, but to make each acquisition more productive through better conversion and longer retention.
Q5 : What is the difference between ecommerce growth and ecommerce scaling?
Ecommerce growth is adding revenue through more customers, higher AOV, or better retention. Ecommerce scaling is adding revenue without adding proportional cost or operational complexity. Scaling requires a repeatable system: automated acquisition channels, a conversion stack that performs without constant manual intervention, and a retention loop that runs on behavioral triggers. Growth without this infrastructure hits a ceiling. Scaling extends that ceiling systematically.
Q6 : How long does it take to see results from an ecommerce growth system?
A foundational system unified analytics, acquisition framework, basic CRO, and a post-purchase retention sequence can be operational within 60 to 90 days for a business with proven product-market fit. The compounding effects typically become visible in revenue metrics at the 90–180 day mark, as cohort data matures and repeat purchase rates begin to reflect the retention improvements. The first month usually shows efficiency gains; the compounding shows in month three and beyond.

Founder & CEO of Anaia Marketing, Dominique doesn’t manage traffic. He builds systems that grow revenue, predictably, measurably, without guesswork. With 15+ years at the intersection of search strategy and editorial precision, he focuses on what matters : turning organic growth into a compounding asset that moves revenue.


Pingback: Ecommerce growth engine: how to build self-funding revenue
Pingback: Revenue growth metrics: 8 KPIs that predict revenue
Pingback: How to do seo for ecommerce product pages ?
Pingback: Ecommerce growth hacking: a fast-testing framework for 2026
Pingback: Ecommerce revenue growth: data, benchmarks and key drivers
Pingback: Ecommerce growth trends: what's actually driving revenue
Pingback: Ecommerce growth accelerator: frameworks that actually work
Pingback: How to define your ICP in B2B: a step-by-step guide